I've been creating infographics long before they were called infographics. Starting in the pharmaceutical industry back in the early 80s, I was required to breakdown the complexities of how one life-saving drug impacted the GI Tract, or how a new cancer treatment could shrink a tumor.
Back then we prepared everything by hand to be photographed on a FOROX camera for a corporate slideshow. Working with surgeons, oncologists and device manufacturers, required an in-depth knowledge of biochemistry and anatomy.
My father had a bachelors degree in chemistry from Lebanon Valley College in Pennsylvania, and a doctorate in Chiropractic Medicine from Palmer College. On top of that, my best friend's father was a General Practitioner and a Surgeon at The Good Samaritan in Lebanon, PA.
In other words, I grew up fully immersed in both sides of the healthcare industry.
Today my infographics are much easier to create, using Adobe Illustrator, Photoshop and Clip Art.
Here are just a few examples of what I've created.

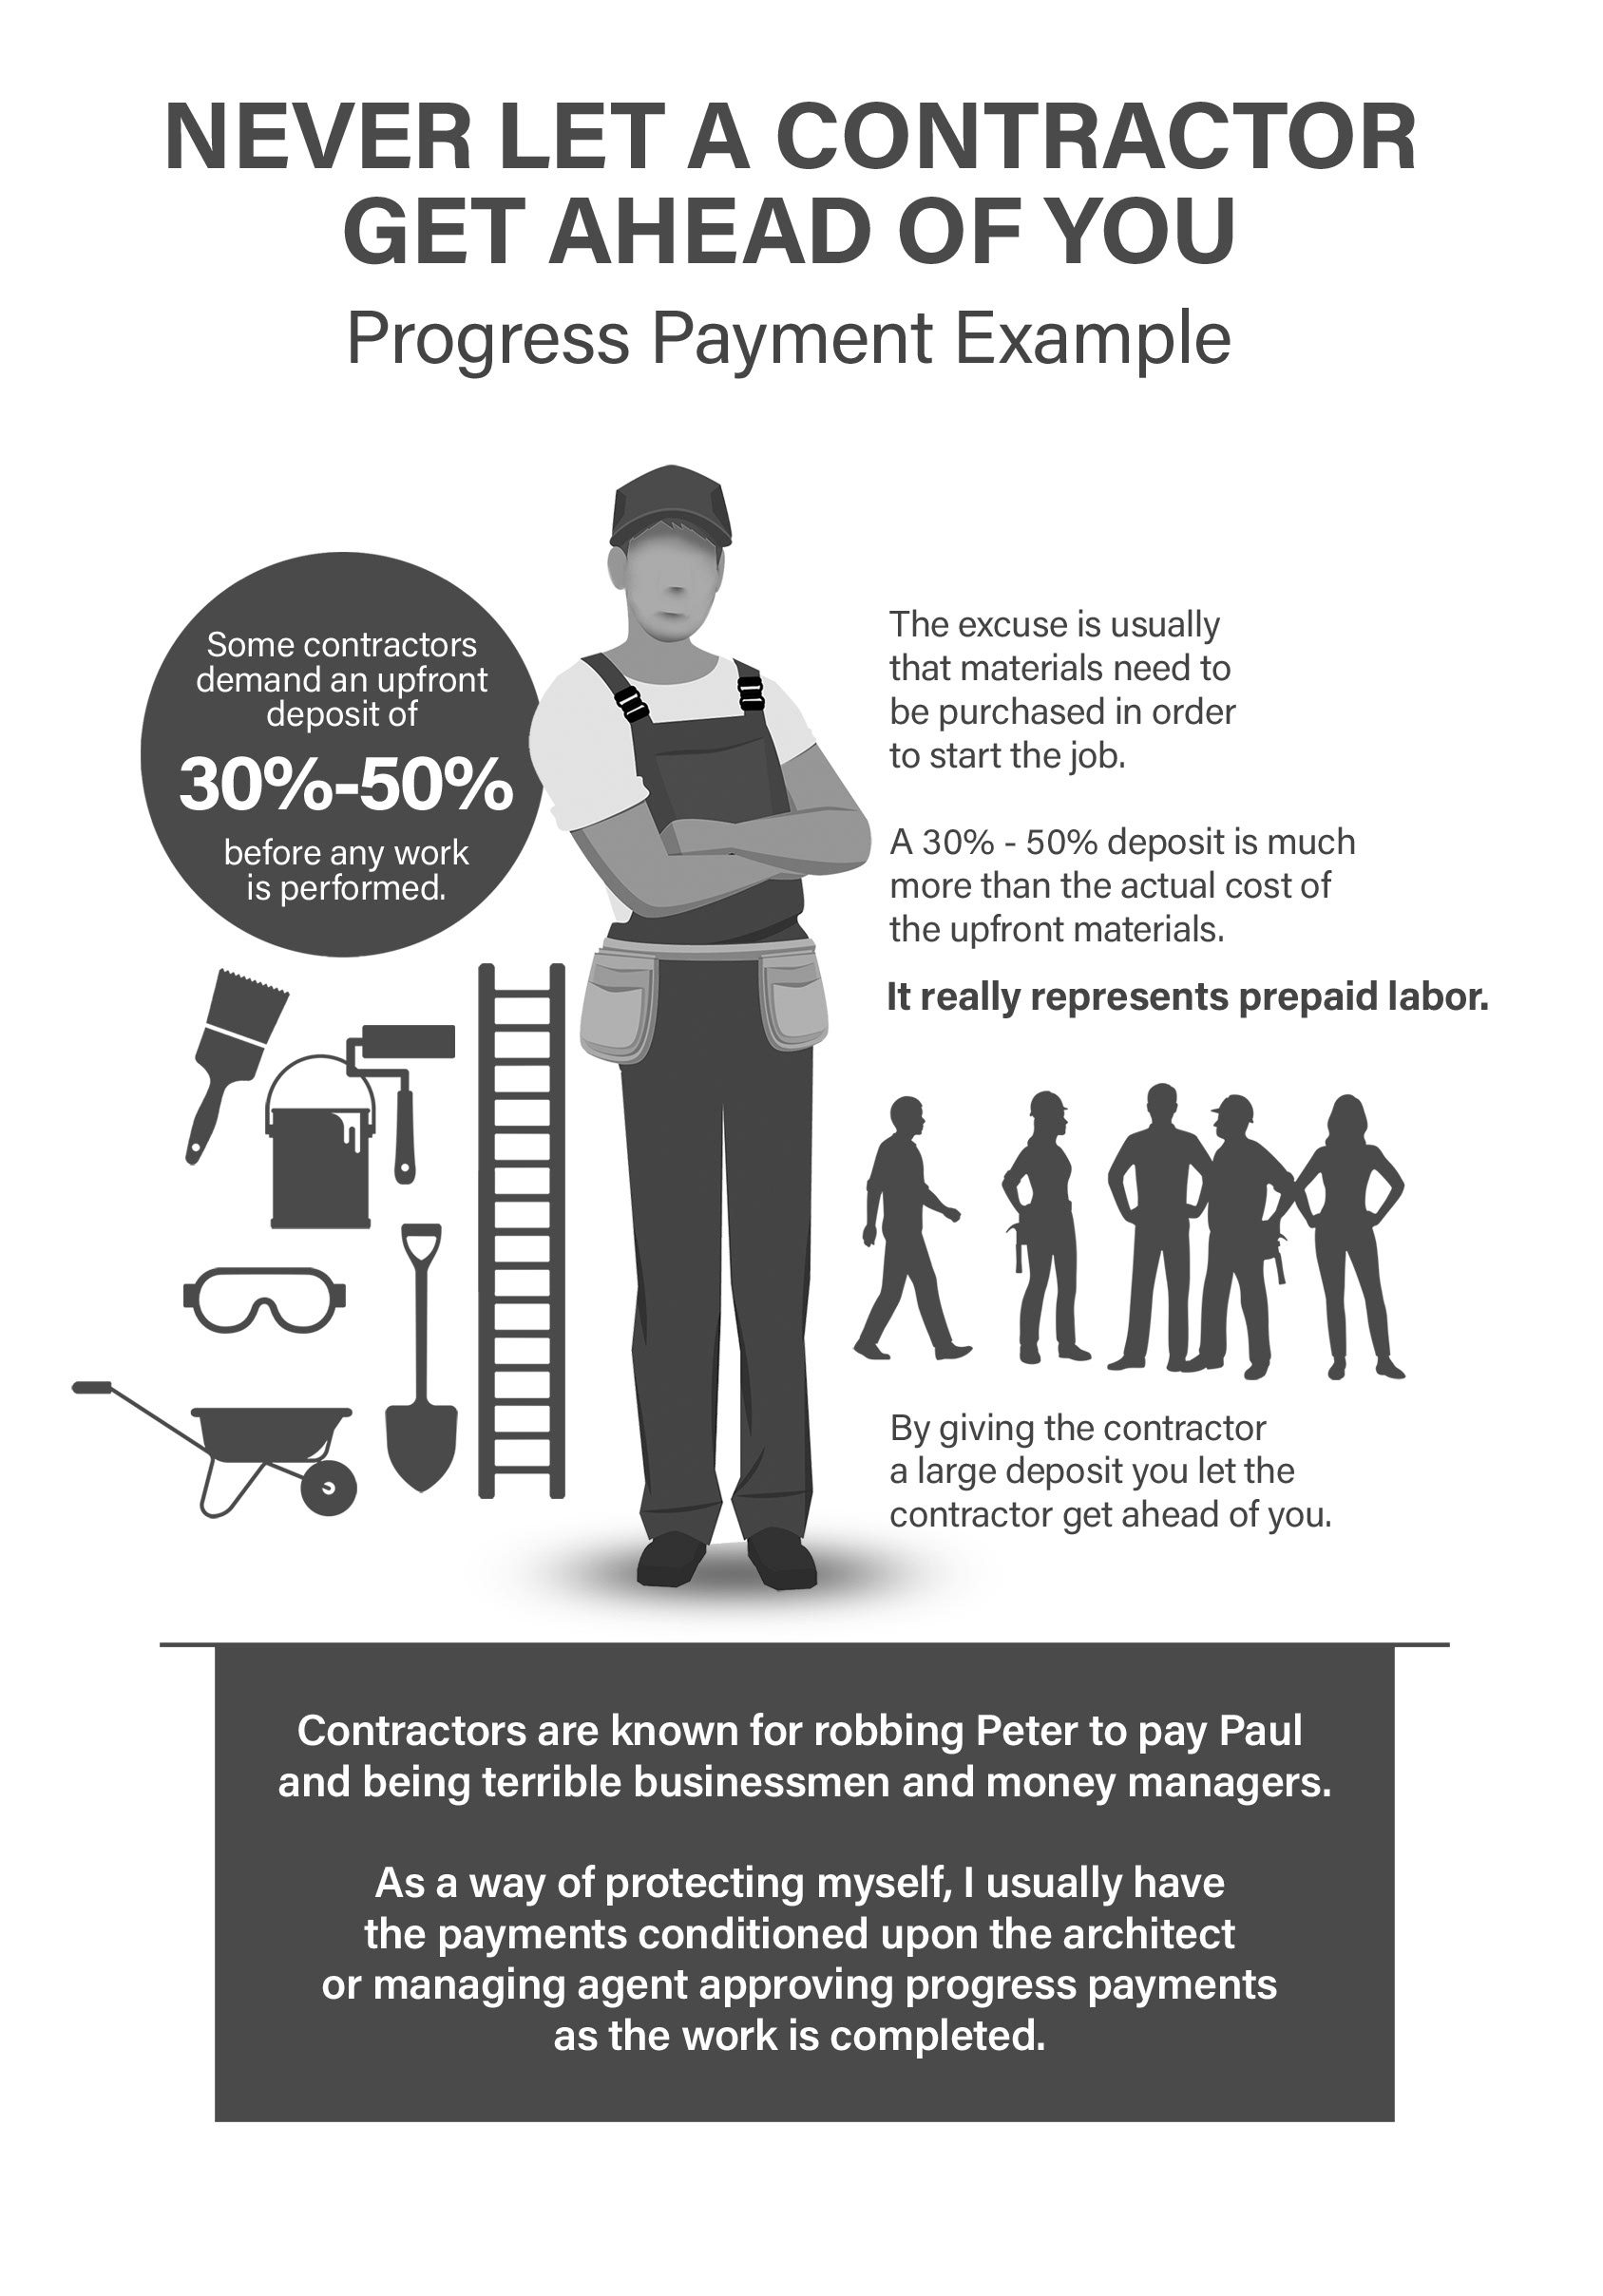
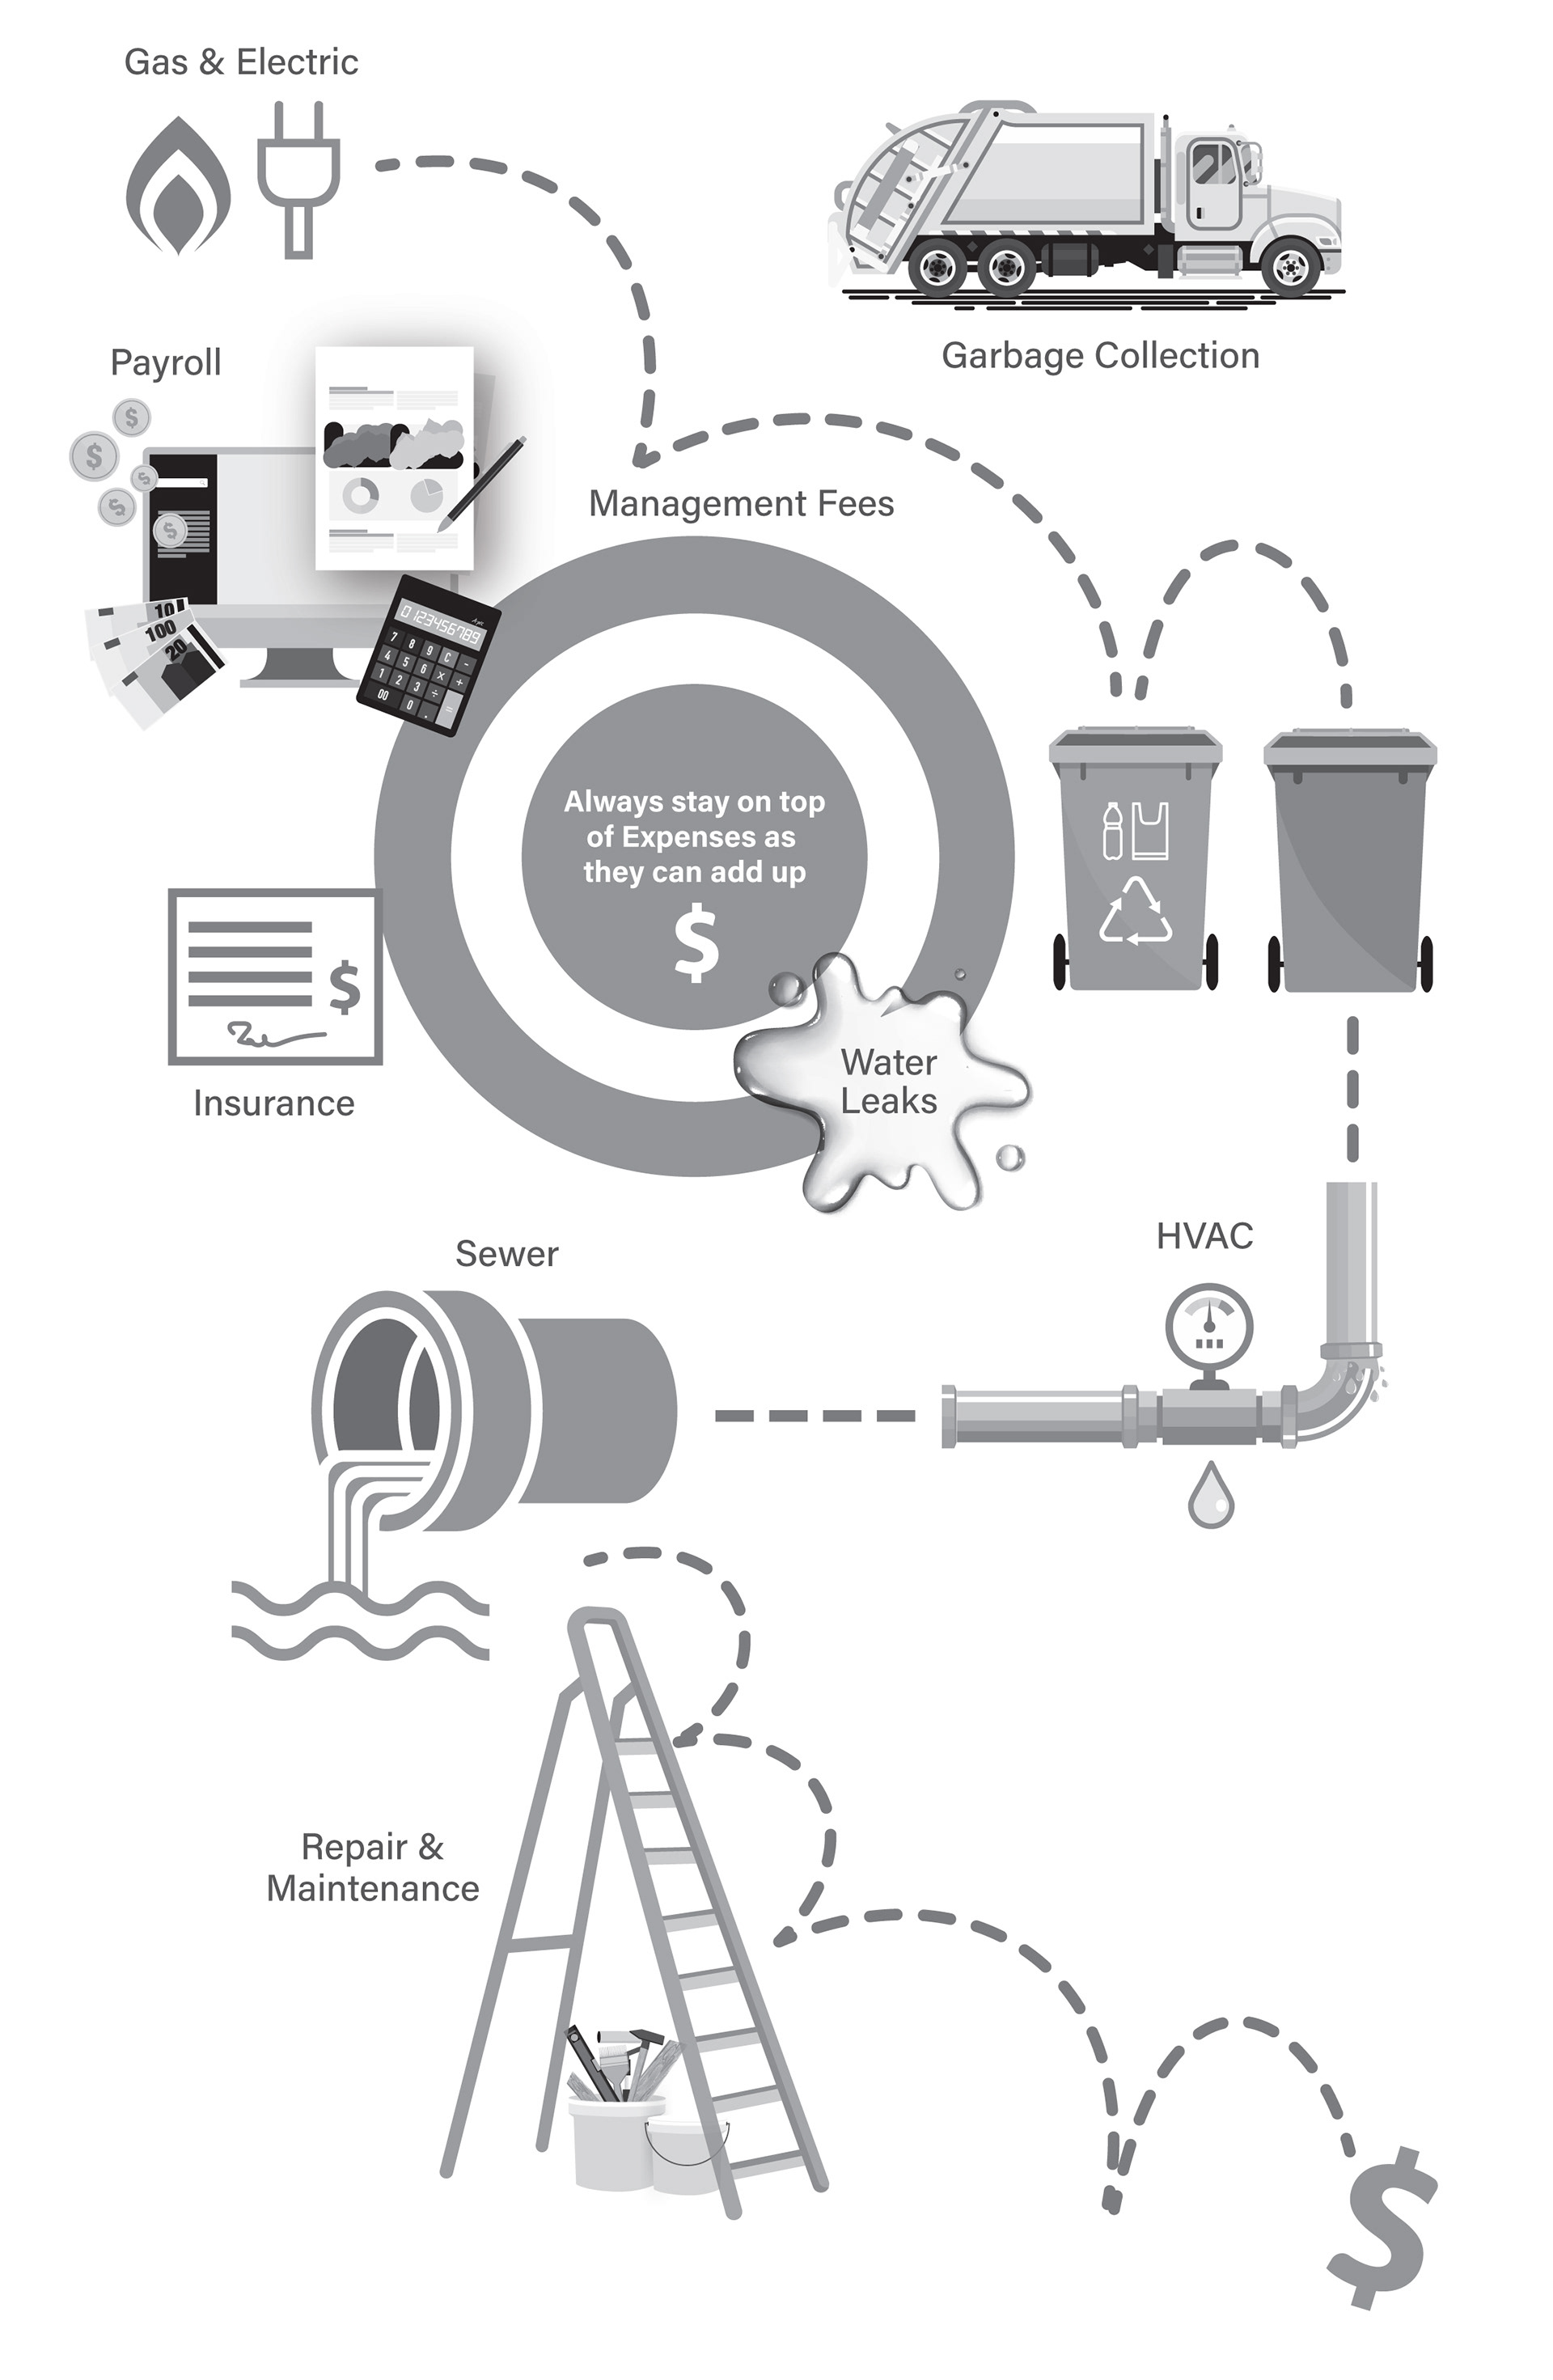
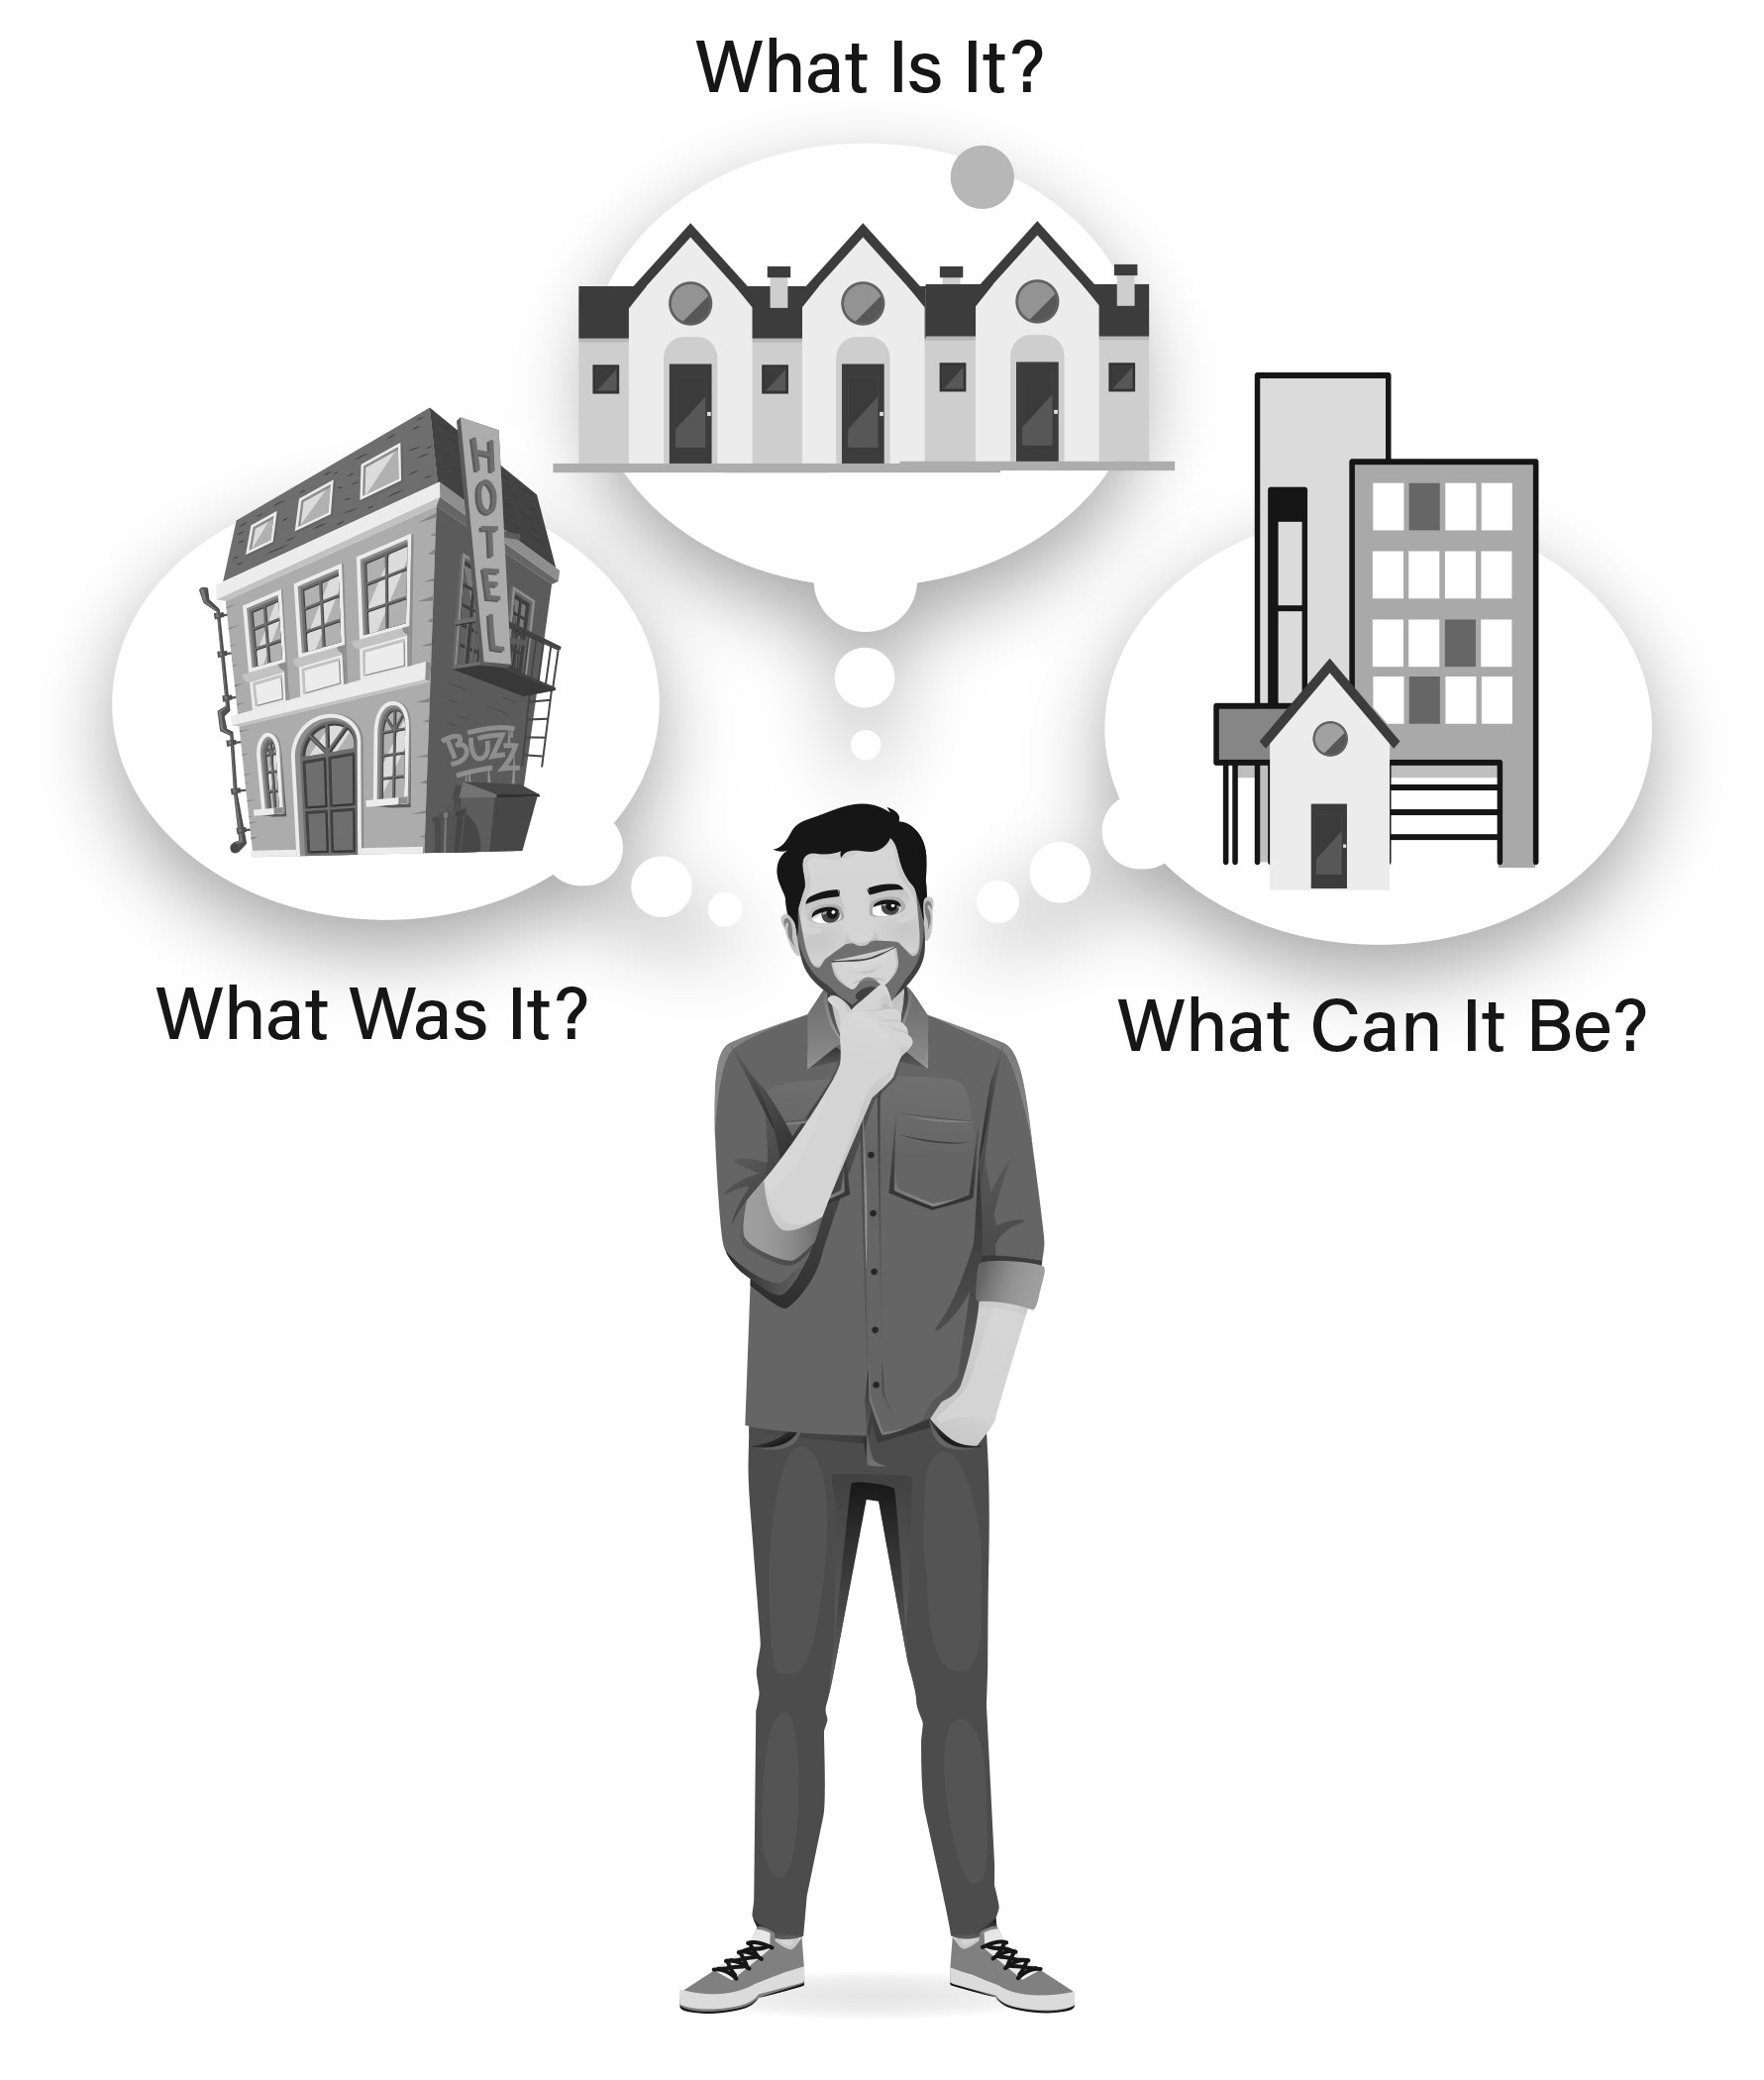
The following graphics were for Sam Liebman's book "Harvard Can't Teach What You Learn from the Streets: The Street Success Guide to Building Wealth through Multi-Family Real Estate."
Most of these infographics were used to explain complex strategies in the real estate industry.


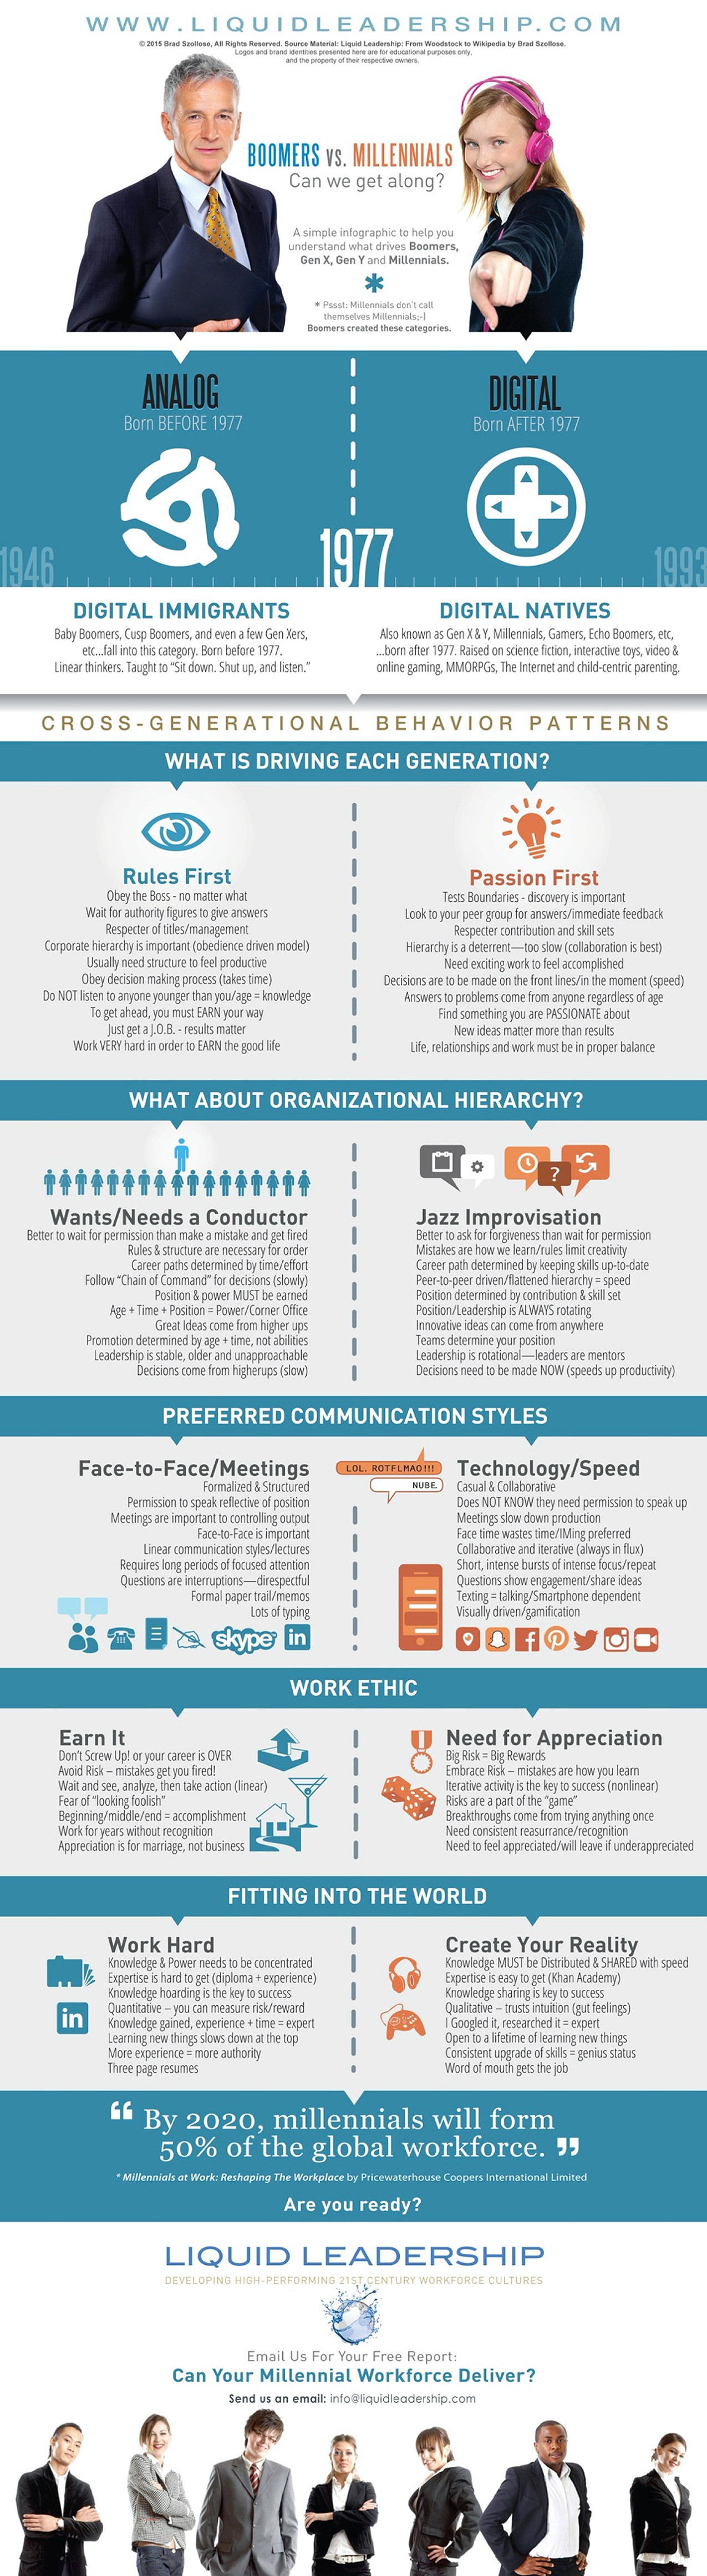
With the release of my first book Liquid Leadership, I felt I needed an infographic to explain the generational divide...let's be honest; what motivates a Baby Boomer will NOT motivate a Millennial.
And where does GenX and GenZ stand in all of this?
The infographic below, explains it all.

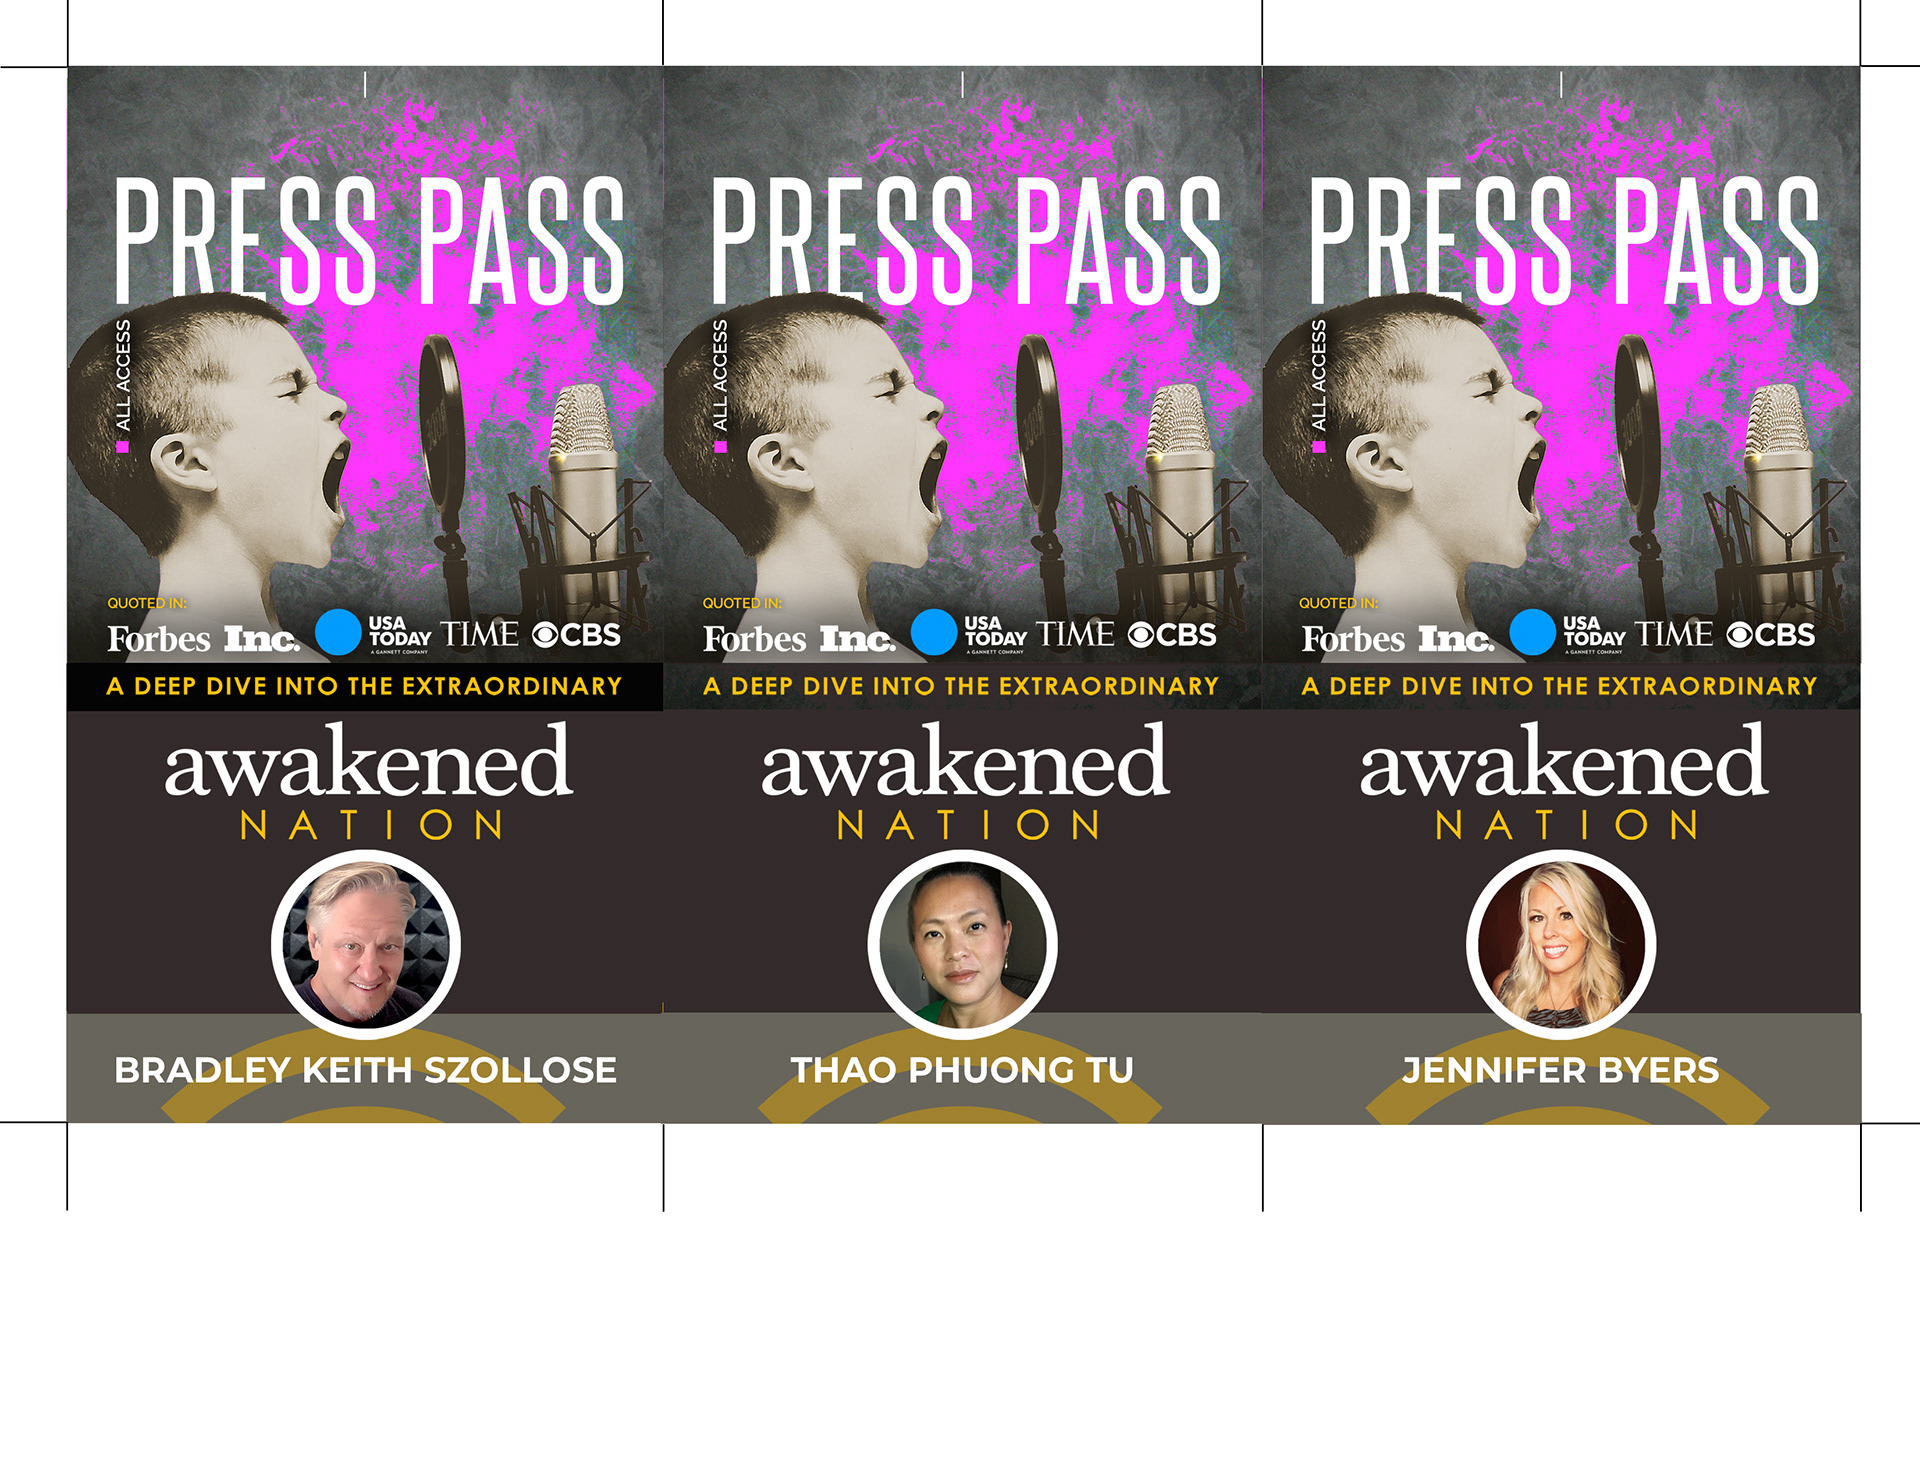
This year I was asked to interview a few people for my podcast at a very large rally.
I was receiving the standard Press Pass from the event planner, but decided to create a branded pass so people in the media pit would remember Awakened Nation.
I was receiving the standard Press Pass from the event planner, but decided to create a branded pass so people in the media pit would remember Awakened Nation.

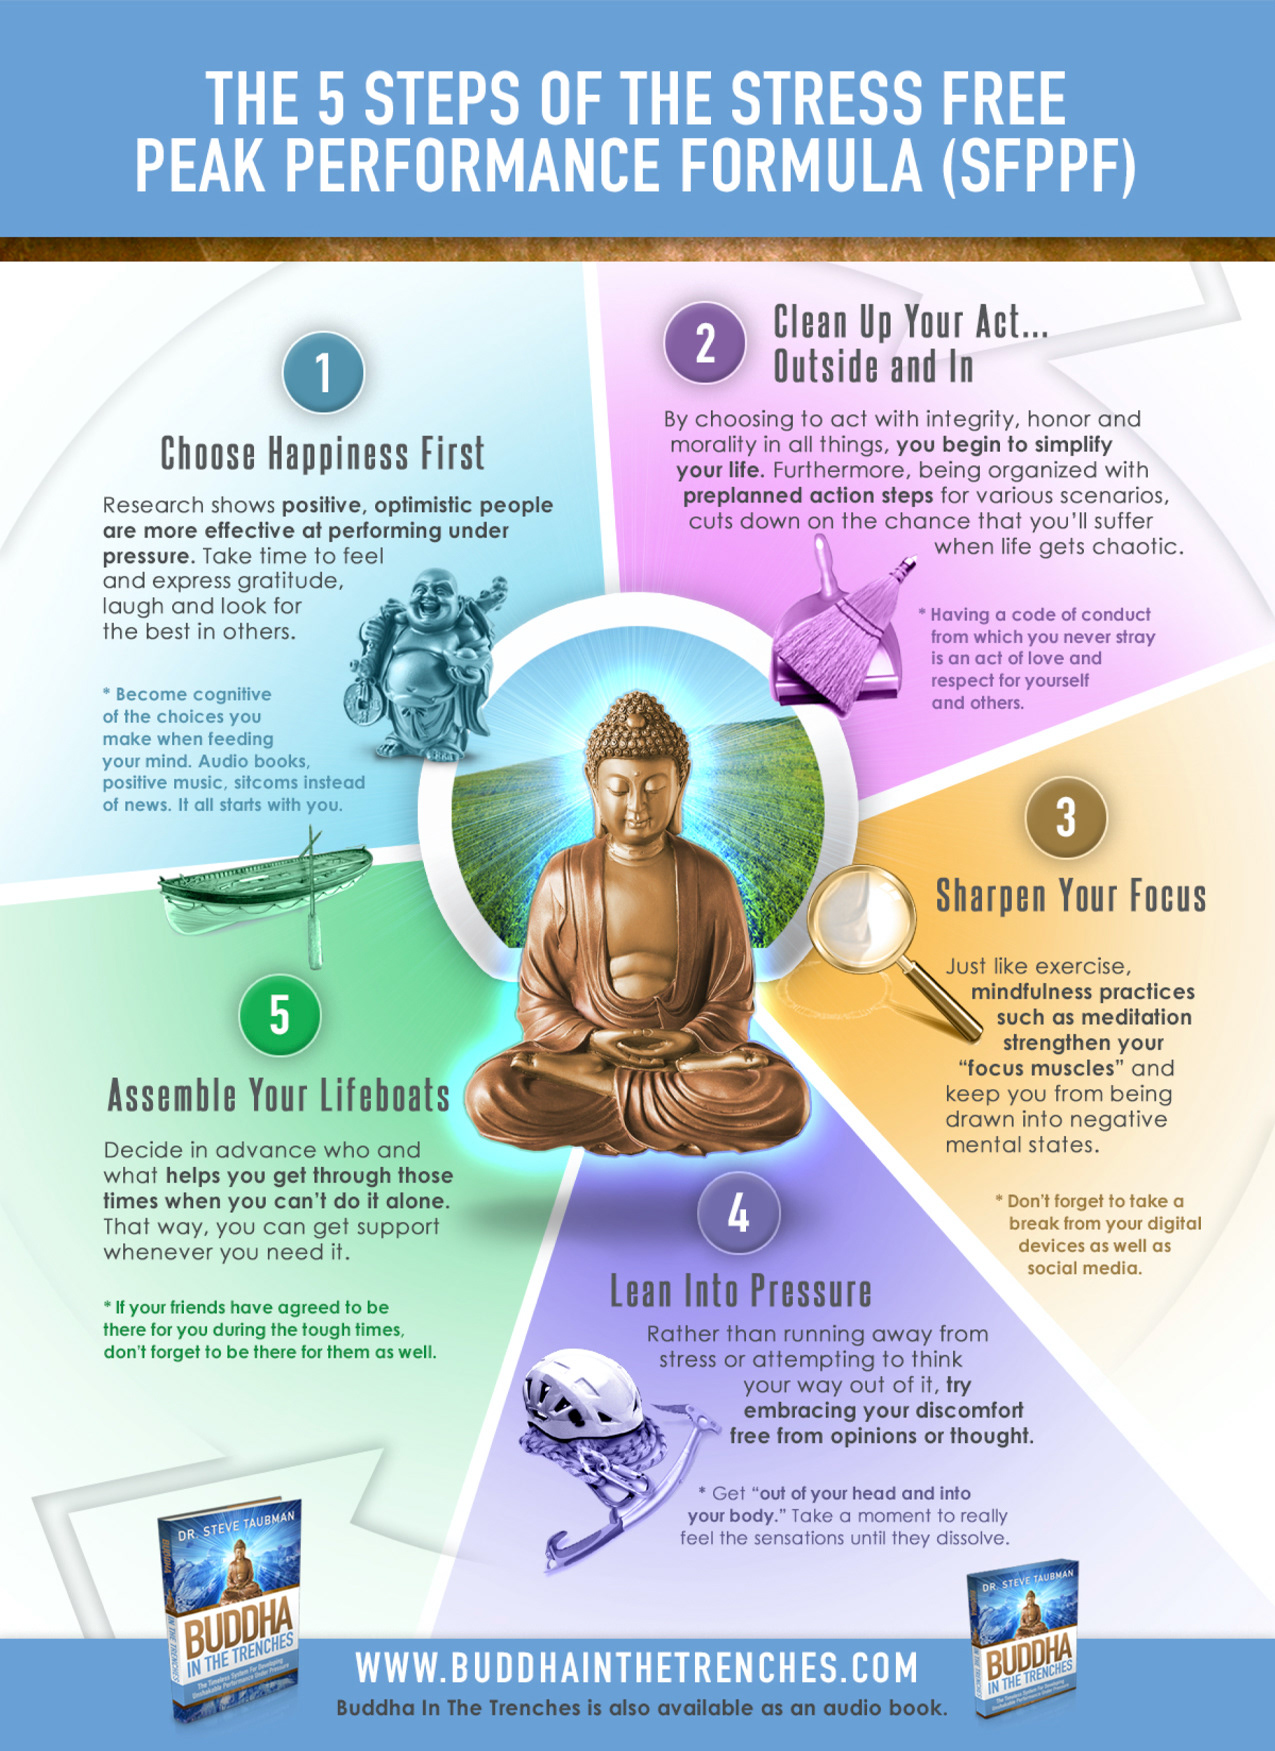
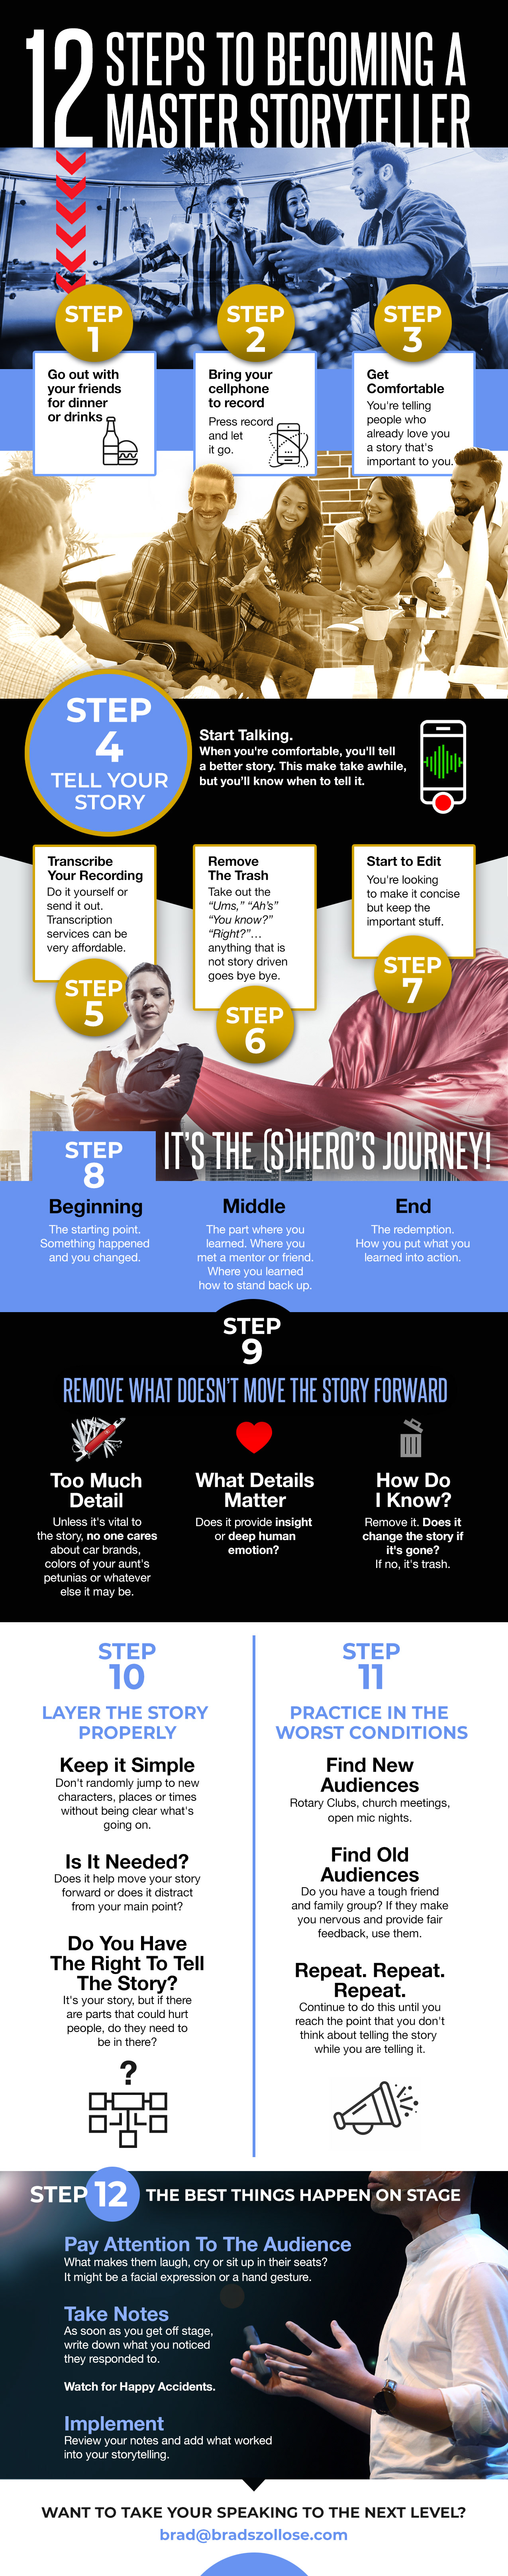
Buddha in The Trenches is one of my favorite projects as I wasn't just the book designer, I had a small contribution to 3 chapters and created printed graphics that were meant to be printed posters.